Puma Sales and Returns November 2024 Transaction Dashboard
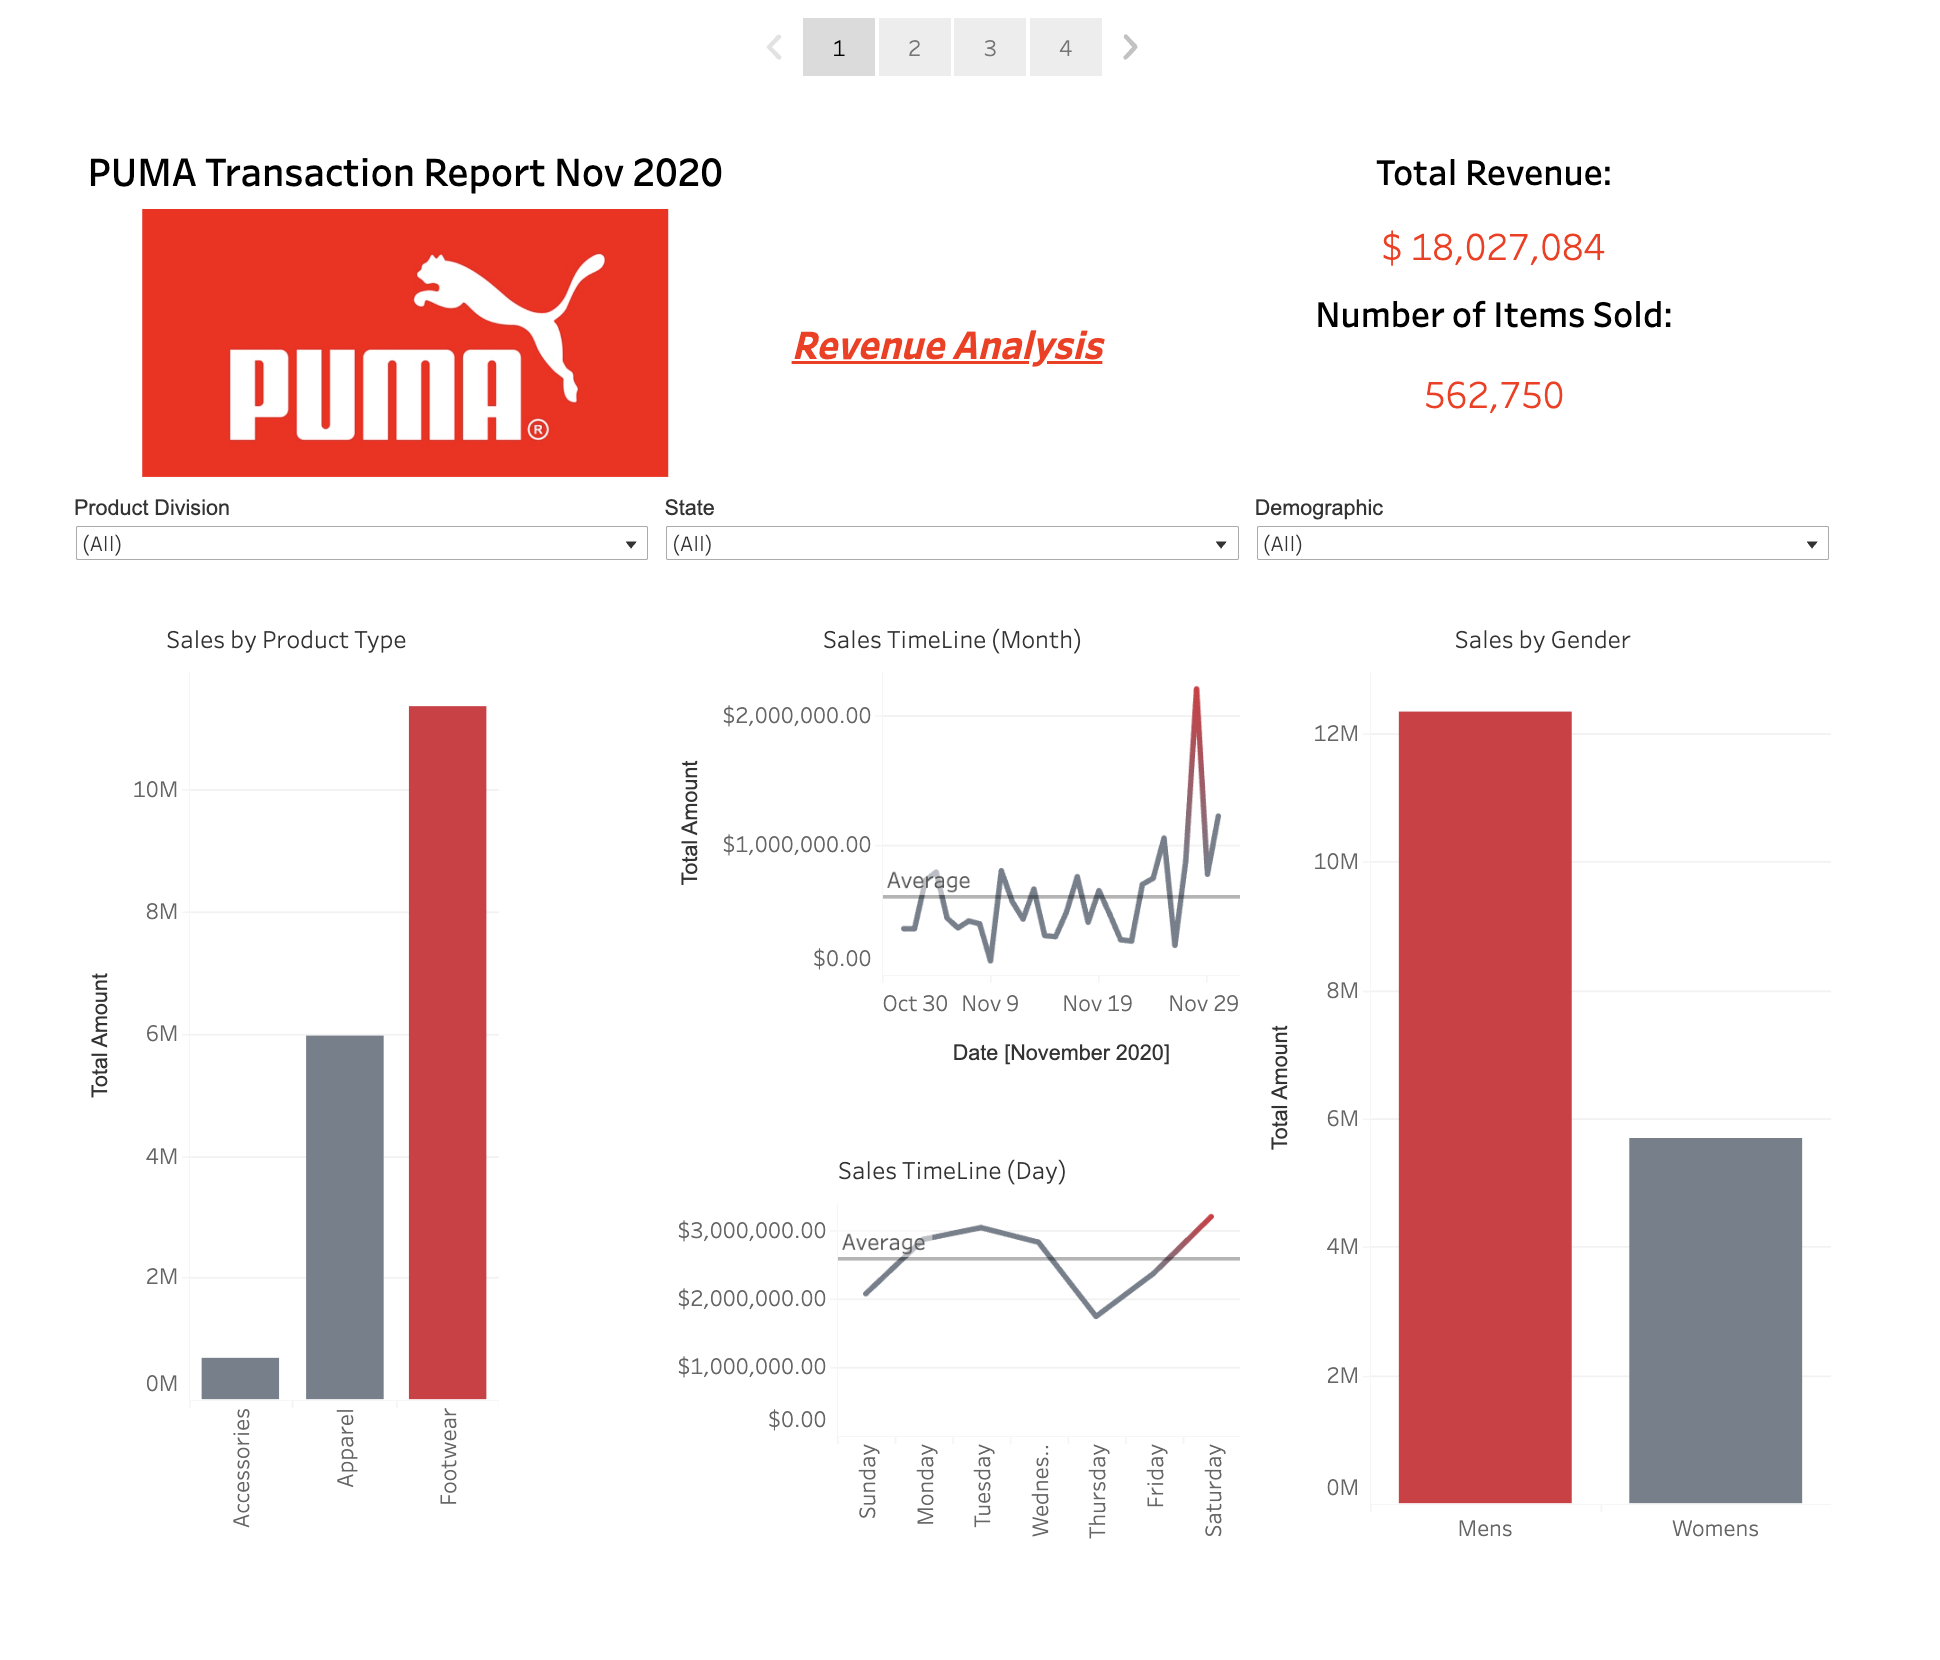
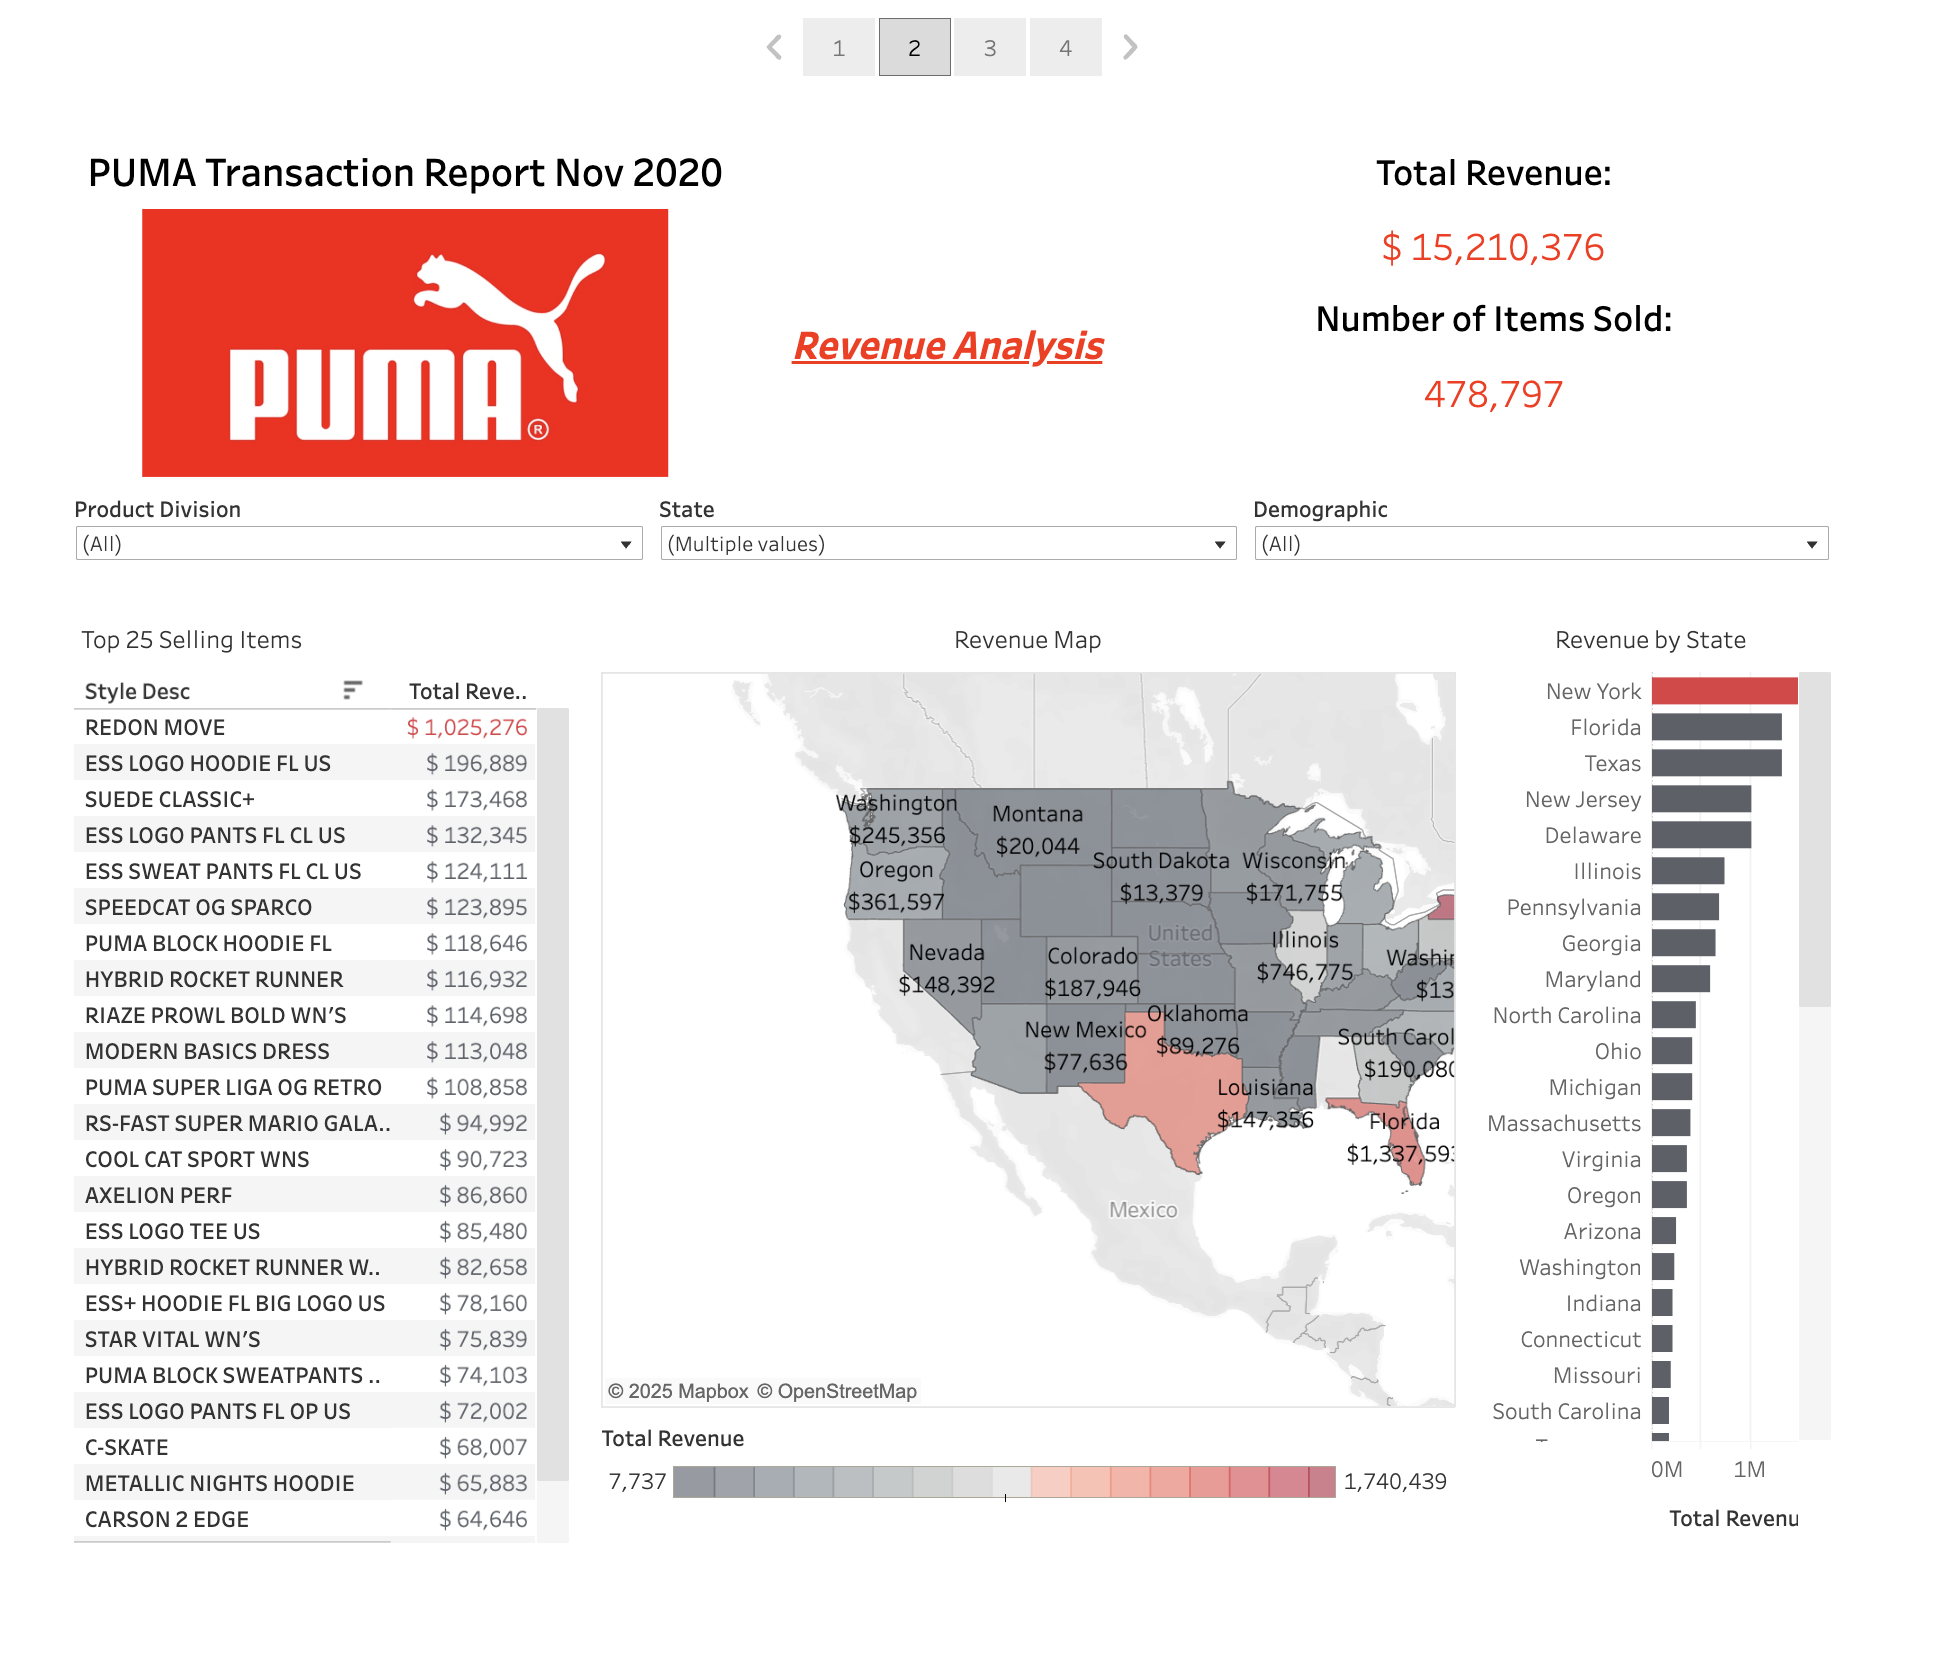
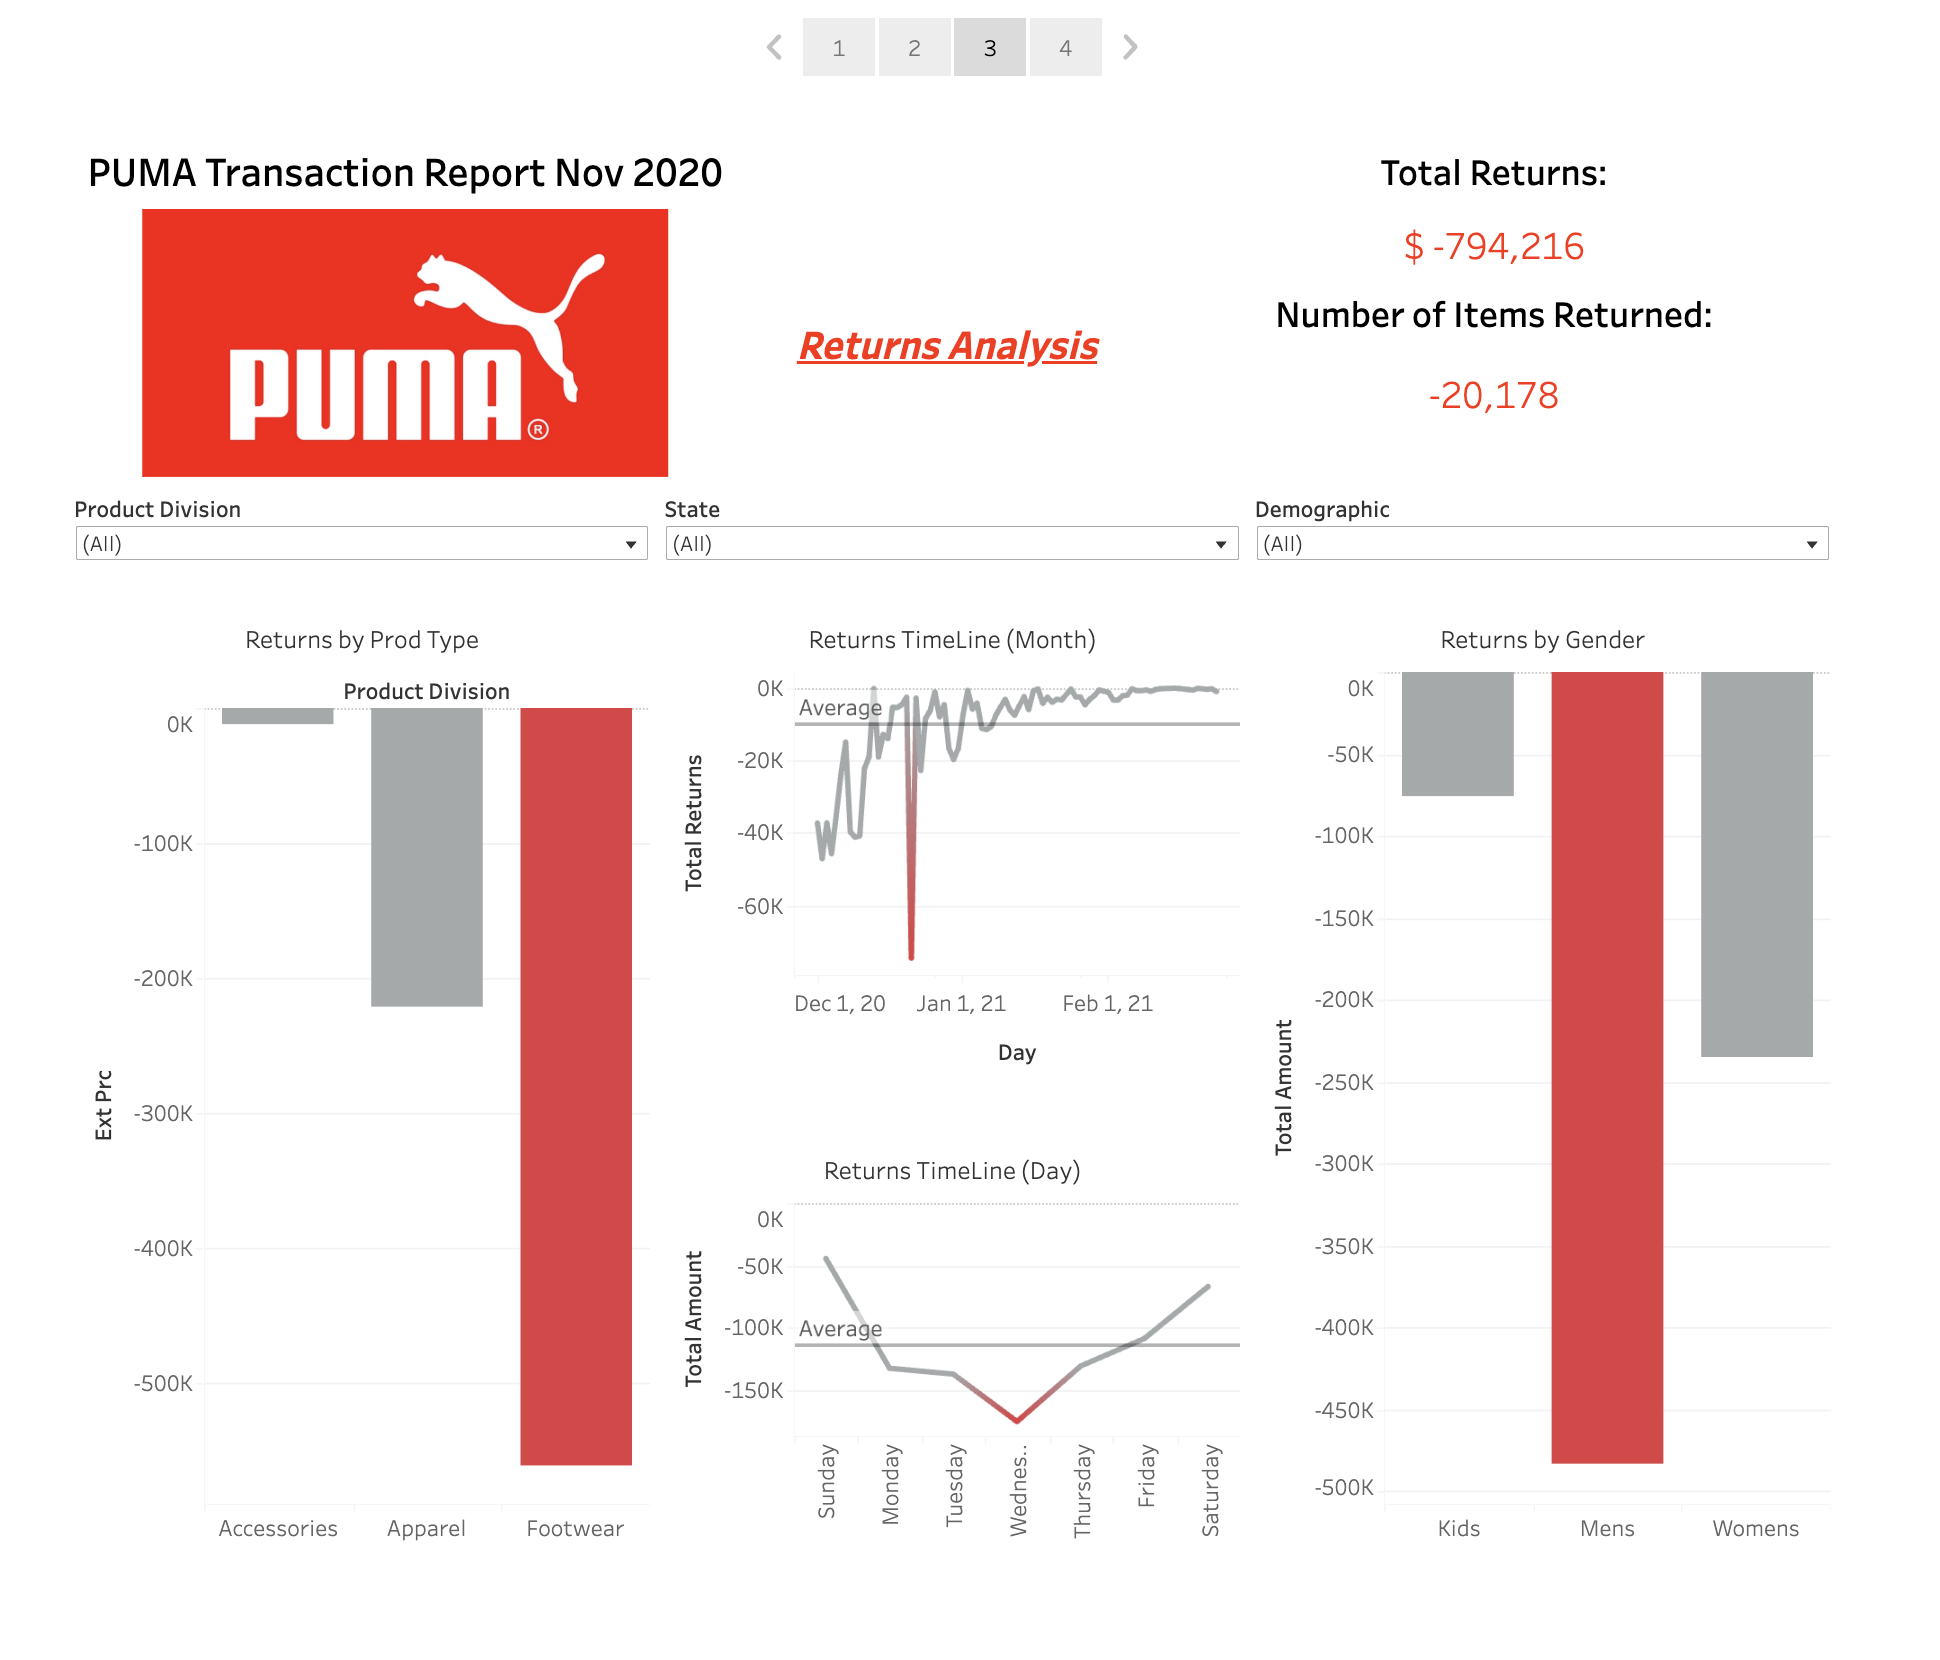
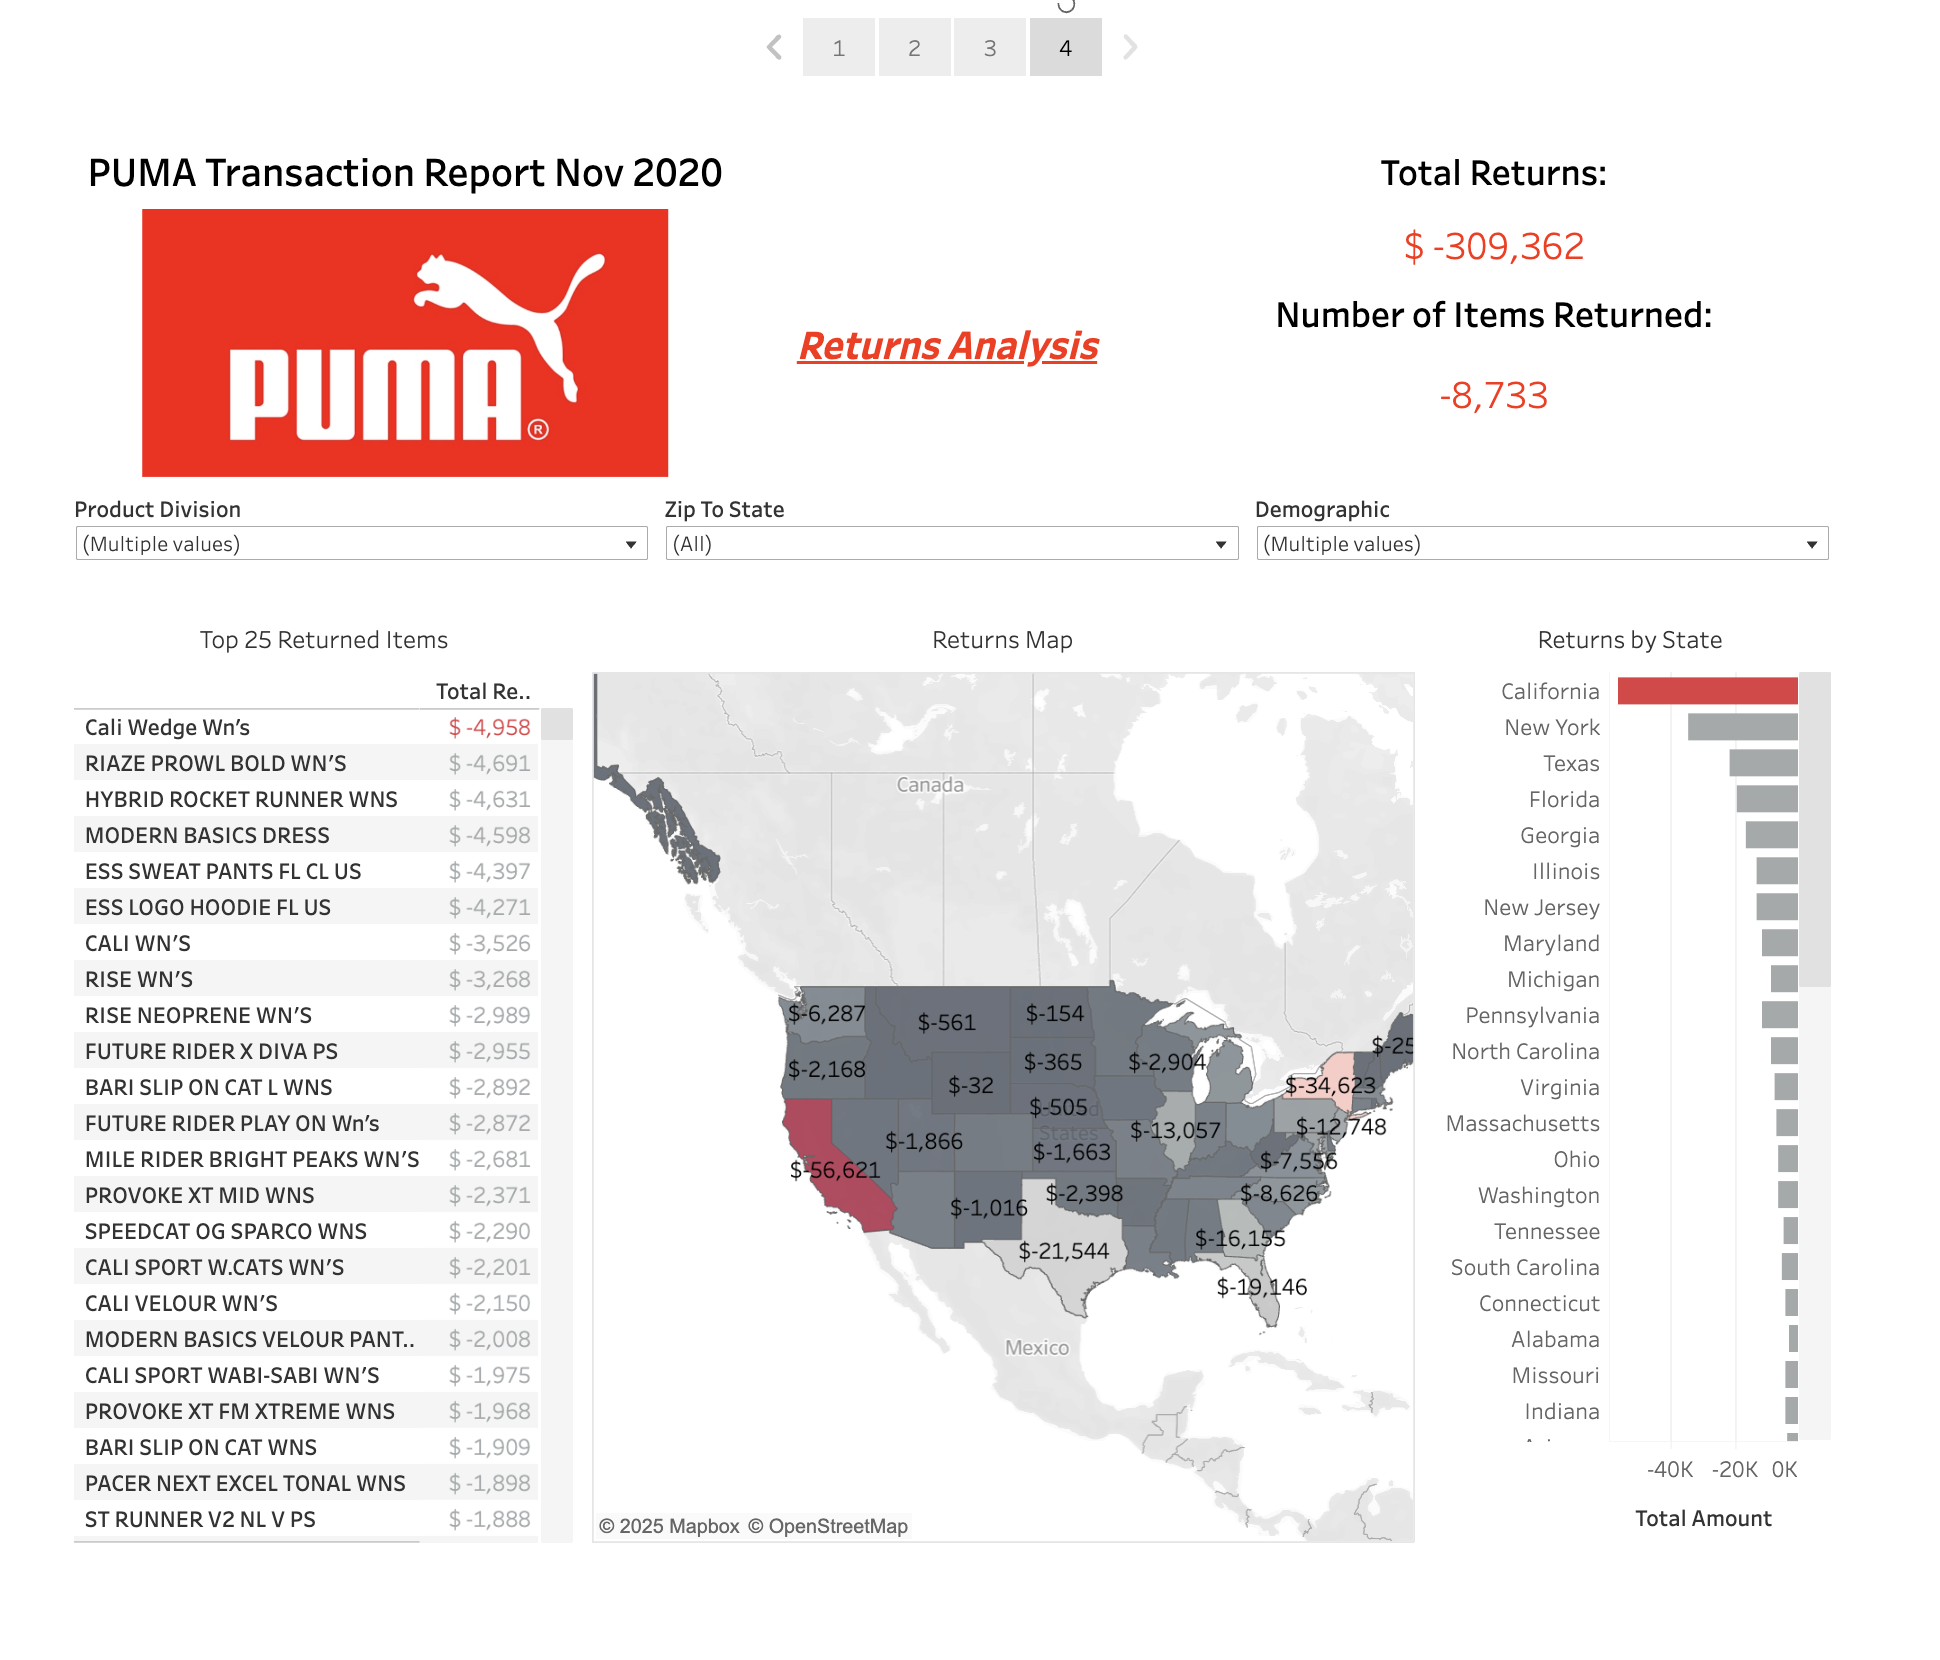
This dashboard visualizes Puma's key sales metrics for November 2020, including total revenue/purchases, units sold/returned, and top-performing/returned products. Interactive filters allow users to explore revenue by state, demographics, and product division for deeper insights.
Technical Overview
- Data Preparation and Cleaning: Python
- Dataset Joins: SQL
- Dashboard and Visuals: Tableau
Description
This dashboard provides a clear and concise overview of Puma's sales and returns performance for November 2020. Key metrics like total revenue ($15,210,376), the number of items sold (478,797), total returns ($794,216) and the number of items returned (20 178) are prominently displayed. The dashboard effectively visualizes top-selling/returned items, revenue by state, and a geographic revenue map. The user-friendly interface allows for easy filtering by product division, state, and demographic, enabling a deeper dive into the data. The inclusion of a Top 25 Selling Items list and a Revenue by State bar chart makes it easy to quickly identify key performance indicators and trends.


Want me to help with your project?
Leave me a message here and I will be in touch shortly
